


Main content
Since the end of the 19th century, studies on human growth in representative samples of healthy children have been performed in European countries and the USA, and in the last 70 years growth studies have been carried out in almost all countries of the world. Measurements of height, weight and various other anthropometric parameters have been used to study patterns of infant, child and adolescent growth and to generate growth charts. Growth charts visualize growth and enable the comparison of individual growth with that of a reference population; they are used for clinical purposes and to monitor trends in child nutritional status in entire communities. A growth chart is considered a ‘road to health’. However, growth charts differ quite a bit between countries, so the question arises: which growth chart should be used to determine if a child grows normally?
This dilemma is evident in many low- and middle-income countries, and particularly in Asian and Latin-American populations. As it is a priori not decidable whether differences in child growth are due to differences in ethnicity, in health and nutrition, or due to socio-cultural and economic factors, the dilemma has led to two alternative concepts of describing child growth: 1) by descriptive growth charts and 2) by prescriptive or normative growth charts. Descriptive growth charts, also called growth references, describe how children do grow; normative charts, also called growth standards, describe how children should grow.
The rationale for normative growth charts reaches back to recommendations of a Working Group on infant growth, established in the early 1990s by the World Health Organization (WHO), which emphasised the similarity in early childhood growth among diverse ethnic groups.¹ The recommendations are based on six longitudinal child growth studies from birth to the age of five from Brazil, Ghana, India, Norway, Oman and the United States. These children had been exclusively or predominantly breastfed, grew up under affluent conditions, and showed similar growth patterns.² The observations fuelled the assumption that growth is driven by the environment. This idea implies that the same growth standard can be used for all countries in the world and can detect unfavourable living conditions (WHO Child Growth Standards, WHO-CGS). As it was not considered feasible to perform similar longitudinal growth studies in older children, the corresponding international ‘normative’ charts for 5 to 19 years of age were developed based on 1977 USA growth references.³
Normative growth charts are widely used. By April 2011, 125 countries had already adopted WHO growth standards. Weight-for-age has been adopted almost universally as a standard parameter, along with height-for-age (104 countries) and weight-for-height (88 countries) to fully realize ‘the child’s right to achieve its full genetic growth potential’.⁴
But the consequence of using normative growth charts is the so-called ‘stunting syndrome’.⁵ According to UNICEF’s definition of stunting as a height below minus two standard deviations from the median height-for-age of the WHO standard population, the stunting syndrome is prevalent in many developing countries, particularly in Asia; growth failure is found in an estimated 165 million children below five years of age. For example, in Indonesia, based on a multistage cluster sample of 497 districts (urban and rural) of 33 provinces, including 294,959 households with 1,027,763 household members, the average prevalence of stunting below the age of five was 36.8% in 2007 and 37.2% in 2013. The average height of Indonesian 18 year old males and females is 12.5 cm and 9.8 cm below the WHO reference, respectively (Indonesian national report on basic health research as communicated by Prof. Madarina Julia, Yogyakarta, Indonesia, personal communication 2016).
Stunting is not limited to the poor and the undernourished. If we define stunting in line with the WHO and UNICEF, it is a common phenomenon also among the wealthy and healthy. ‘Stunting’ was common in 18ᵗʰ and 19ᵗʰ century upper-class Europeans. In Germany, up to 50% of the 7 to 18 year old students at an 18ᵗʰ century elite school and of sons of the wealthy upper-class societies of the second half of the 19ᵗʰ century were stunted according to modern criteria.⁶ Figure 1 illustrates that their growth pattern was almost parallel to that of modern Indonesians.
Meanwhile, the average height of adults has increased in Europe and many non-European countries. This phenomenon is referred to as the secular trend in height. For example, in Swedish conscripts, average height increased from 168 to 180 cm between 1850 and 2000, and in the Netherlands an even greater secular trend of 19 cm was observed (from 165 to 184 cm in adult males between 1860 and 1997, without any further increase).⁷,⁸ Secular trends are country specific. The trends started and stopped earlier among Northern than among Southern Europeans. In Sweden, the trend stopped 20 years earlier than in the Netherlands, while its magnitude was 7 cm less. Trends in height usually coincide with trends in maturation tempo. Modern societies show a marked shift towards earlier pubertal development. In Japan, the secular increase of average adult height of 5.5 cm between 1960 and 2000 was accompanied by a 1 year faster maturation tempo.¹⁰ Trends in tempo are also country specific; the onset of puberty occurs later in Northern European than in Eastern Asian and Mediterranean populations.⁹,¹¹
Secular trends can differ between ethnicities even within the same country. In the 1997 Dutch growth study, children of Moroccan and Turkish immigrants were on average 5 cm shorter in childhood, and the differences increased to 10 cm in adulthood. Between 8% and 14 of prepubertal immigrant children (3-10 years) would be considered stunted (height SDS <-2) if compared with the 1997 Dutch reference charts. Whereas the secular trend in height has stopped in the children of Dutch origin, it seems to be continuing in migrants. In 2009, 18-year olds of Moroccan and Turkish descent were 2-3 cm taller than 12 years earlier.¹² The trend in children of South Asian origin living in the Netherlands was less marked: only a 1.3 cm and 2.3 cm increase between 1976 and 2010 in girls and boys, respectively.¹³ Similar heterogeneous observations have been reported from various European and non-European countries. Figure 2 illustrates that a secular trend in height is also found in Indonesia.
The association between height, nutrition and population health has been studied intensively, with no consistent across- and within-country relationship found between height on the one hand and childhood mortality or living conditions on the other.¹⁴ In particular, African women are taller than one would expect on the basis of their low incomes and high childhood mortality, and South Asian women are shorter. In other words, the general assumption that stunting can be considered a health indicator is at variance with the discrepancy between people’s average height and their average socio-economic condition.
In view of the encouraging European experiences with multiple national growth reference charts, it appears justified to prioritize the concept of national growth reference charts over international charts, particularly for countries where children who were raised under affluent conditions differ substantially from the international norms. It is now possible to generate national growth reference charts by amalgamating information from very large international sets of growth data (based on a recent meta-analysis of 196 female and 197 male growth studies published since 1831) with regional data characterizing growth of the population of interest. Such charts have been termed ‘synthetic growth references’. They are cost-effective and could be introduced for all populations that lack autochthonous national growth references.¹⁵
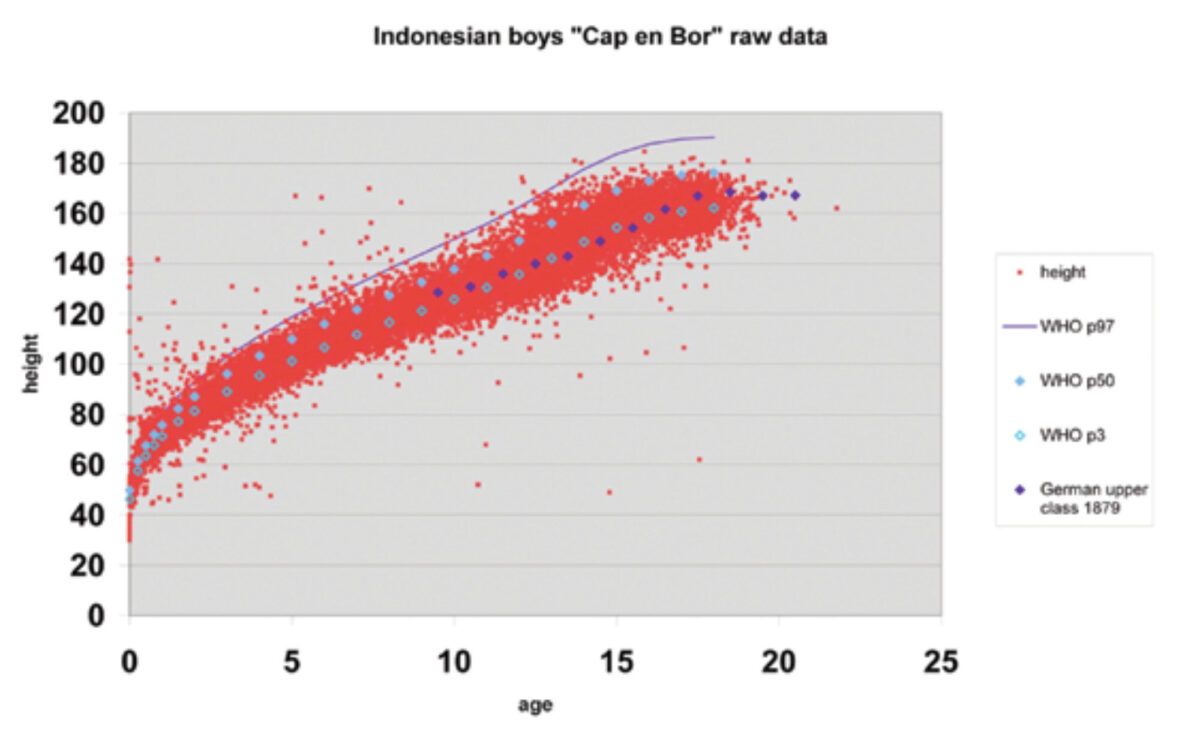
(Image: Scatter plot titled “Indonesian boys “Cap en Bor” raw data” showing height (cm) vs age (years) with data points for Indonesian boys, and lines for WHO p97, WHO p50, WHO p3, and German upper class 1879.)
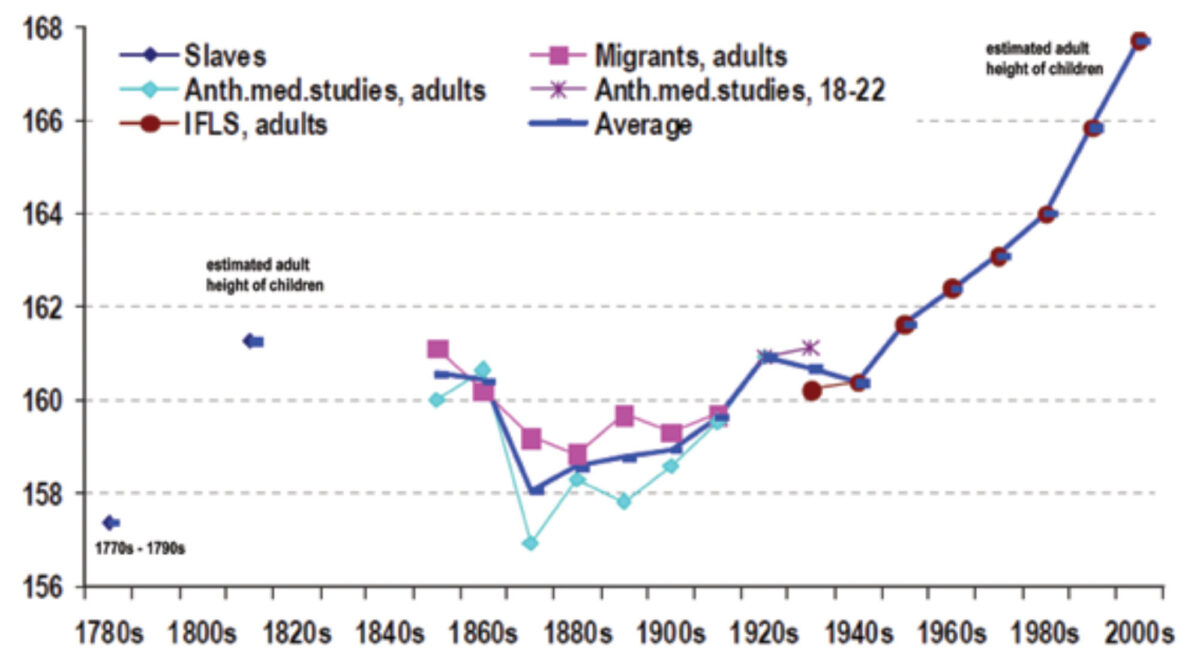
(Image: Line graph showing estimated adult height of children and average male height in Indonesia by birth decade from 1770s to 2000s, with different lines for Slaves, Anth.med.studies, adults, IFLS, adults, Migrants, adults, Anth.med.studies, 18-22, and Average.)
References
- Garza C, de Onis M. Rationale for developing a new international growth reference. Food Nutr Bull 2004;25:S5-14.
- WHO Multicentre Growth Reference Study Group. WHO child growth standards based on length/height, weight and age. Acta Paediatrica Supplement 2006;450:76-85.
- de Onis M, Onyango AW, Borghi E et al. Development of a WHO growth reference for school-aged children and adolescents. Bull World Health Organ 2007;85:660-667.
- de Onis M, Onyango A, Borghi E et al. Worldwide implementation of the WHO Child Growth Standards. Public Health Nutr 2012;15:1603-10.
- Prendergast AJ, Humphrey JH. The stunting syndrome in developing countries. Paediatr Int Child Health 2014;34:250-265.
- Komlos J, Tanner JM, Davies PS et al. The growth of boys in the Stuttgart Carlschule, 1771-93. Ann Hum Biol 1992;19:139-52.
- Gustafsson A, Werdelin L, Tullberg BS et al. Stature and sexual stature dimorphism in Sweden, from the 10th to the end of the 20th century. Am J Hum Biol 2007;19:861-70.
- Schonbeck Y, Talma H, van Dommelen P et al. The world’s tallest nation has stopped growing taller: the height of Dutch children from 1955 to 2009. Pediatr Res 2013:73:371-77.
- Bonthuis M, van Stralen KJ, Verrina E et al. Use of national and international growth charts for studying height in European children: development of up-to-date European height-for-age charts. PLoS One 2012;7:242506.
- Hermanussen M, Scheffler C, Groth D et al. Height and skeletal morphology in relation to modern life style. J Physiol Anthropol 2015;34:41.
- Parent AS, Teilmann G, Juul A et al. The timing of normal puberty and the age limits of sexual precocity: variations around the world, secular trends, and changes after migration. Endocr Rev 2003;24:668-93.
- Schonbeck Y, van Dommelen P, Hirasing RA et al. Trend in height of Turkish and Moroccan children living in the Netherlands. PLoS One 2015;10:20124686.
- de Wilde JA, van Dommelen P, van Buuren S et al. Height of South Asian children in the Netherlands aged 0-20 years: secular trends and comparisons with current Asian Indian, Dutch and WHO references. Ann Hum Biol 2014;1-7.
- Perkins JM, Subramanian SV, Davey SG et al. Adult height, nutrition, and population health. Nutr Rev 2016;74:149-65.
- Hermanussen M, Stec K, Assmann C et al. Synthetic growth reference charts. Am J Hum Biol 2016;28:98-111.