Main content
My wife and I visited Suriname in April 2024 and contributed to undergraduate and postgraduate education in paediatrics, internal medicine and parasitology at the Academic Hospital in Paramaribo and the Anton de Kom Faculty of Medical Sciences. Suriname is a middle-income country with a population of 616,500 inhabitants, with mean age 33 years; it covers 164 square km and it has a GDP of 14,540 USD per capita. The population is a unique mix of people from various ethnic backgrounds, and people are invariably friendly and polite. The country has ample natural beauty in coastal areas, along the rivers, and in the interior the extensive forest that is continuous with the Amazon forest. The architecture in Paramaribo is famous for its wooden buildings.
Suriname became independent from the Netherlands in 1975, and I did my senior clerkship in obstetrics and gynaecology in the Diaconessenhuis Hospital in 1978. While I was already hooked on internal medicine, it did spark my interest in and commitment to pursuing a career in tropical medicine, with the challenges of working in resource-restricted settings, contributing to health care for those who need it most, and working with the diversity of pathology, both in a general (global) setting and more local settings such as Suriname.
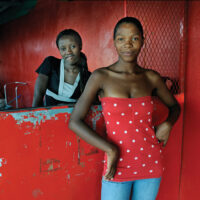
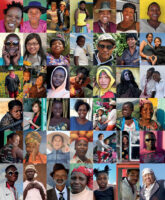
Ethnic groups
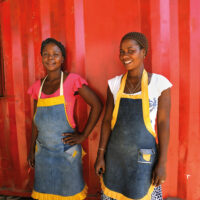
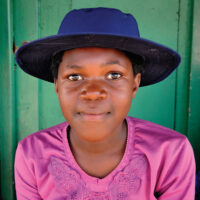
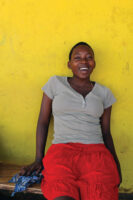
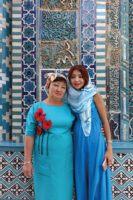
The ethnic breakdown of the population of Suriname is summarized in Table 1. It is not surprising that the slave trade from Africa from the 16th century to its abolition in 1814 played a major role here; plantations were run to produce sugar, coffee and tea, among other products, and a strong and large labour force was needed. The suffering of those affected in this historically unsurpassed breach of human rights, degradation and humiliation is beyond imagination. After the abolition of slave trade, contract workers were brought in from Java and the Indian subcontinent and mixed with spontaneous immigrants such as Chinese, Europeans and other groups to form the typical Surinamese mixed culture. (Table 1). Some of the ethnic groups such as the Javanese, Hindustani, Chinese and Amerindians have largely preserved their ethnic identity.
The Jewish community deserves a special mention here as, in the context of the diaspora, a large Sephardic (Portuguese) Jewish community arrived from 1635, expecting better living conditions under a Protestant coloniser, and settled along the Surinam river in the so-called Jodensavanne (Jewish Savanna). A synagogue was built here in 1685. This isolated settlement of planters was very successful and essentially ran its own affairs in terms of administration, security and education. It was no surprise that, after World War II, the Jodensavanne was one of the options for founding a new Jewish state, which at last was established in Palestine and became Israel.
What are the implications of the ethnic diversity for health in Suriname? This has been the subject of research in, among other, the epidemiology of cardiovascular disease (hypertension, heart failure), diabetes mellitus, metabolic syndrome, infection (tuberculosis), and obstetrics. (Table 2)
Implications of ethnicity for health – the example of hypertension
Among cardiovascular diseases, hypertension has higher prevalence among adults of African descent followed by those of Asian or Hispanic background, compared to Caucasians. [2] In Suriname, cardiovascular disease is the main cause of mortality in each ethnic group. [3] Historical data from 1973 indicate that in a sample of 243 people (40% of African and 43% of Asian ancestry) 40% had hypertension and 15% diabetes; 30% had ever smoked. [4]
More recent studies, carried out in Suriname, showed that prevalence of hypertension (26% in 5748 people examined) was in a similar range as in developing countries, while there was variation within ethnic groups. It was more common in Creoles, Hindustani, and Javanese while it was lowest among Amerindians, Maroons and Mixed. [5] Even more worryingly, half of those diagnosed with hypertension were not diagnosed previously, and only a quarter were treated effectively. [5] But it is not only awareness, prevalence, compliance, or drug availability that determine outcome efficacy. Amerindians have the highest efficacy of treatment and Maroons the lowest, suggesting a specific ethnic approach to treatment of hypertension that may include drug selection and determination of a cut-off point to start treatment. [5]
Health literacy is an independent risk factor for cardiovascular disease: individuals who are female have a low education level and those who live in a rural setting have the lowest health literacy. This needs to be taken into account when delivering health care. [6]
Explanations vary
Table 2 indicates that Hindustani have the highest risk of cardiovascular disease, including hypertension (together with Creoles and Javanese), ischaemic heart disease, diabetes mellitus, and metabolic syndrome. This is in line with data from Asia.
Another interesting finding is the difference in hypertension between creoles and maroons. While both are of African descent and share biological characteristics, creoles live predominantly in urban coastal areas (86%) with only 14% in rural areas, so they generally enjoy higher levels of education and income. Maroons have a similar geographical distribution but lower levels of income and education, suggesting that demographic, lifestyle, and anthropometric factors associated with living under urban conditions may be important (fast food, sedentary work, smoking).
| Ethnic group | When arrived, from where | Number, occupation | Details | % * |
|---|---|---|---|---|
| Hindustani | 1868-1916: recruited from British India | 34,000 arrived, after abolition of slavery, worked on plantations | Largest population group in 2014 | 27% |
| Maroons | Runaway slaves (literally “runaway cattle”), settled in the jungle | Founded their own communities in the jungle | Reinstated rites and traditions from Africa | 22% |
| Creoles and Africans | 1651-1825: brought by force and under cruel conditions from Africa | 250,000 arrived | Forced to work on plantations as slaves | 16% |
| Javanese | 1890-1939: arrived from Java as contract labourers | 33,000 worked in agriculture and cultivation of rice | Still live in closed communities on former plantations | 14% |
| Mixed | All immigrants including also Haitians and Guyanese mixed with other ethnic groups | Widespread | Unique for Surinam: mixture of culture and folklore (festivities, food, music) | 13% |
| Indigenous population (Amerindians) | Tribes: Trio, Wayana, Arowaks, Caraïbes | Live in deep jungle (traditional) or in coastal areas (partly westernized) | Original inhabitants | 4% |
| Chinese | From 1953: contract labourers from Java; later free immigrants also from Macao, Hong Kong and Kanton | Urban areas Run shops and supermarkets | Large social influence | 1% |
| Boeroes | From 1845; immigrants from the Netherlands | Ran plantations without slave labour | Successful in farming and obtaining high offices | <1% |
| Lebanese | From 1890 | Total of 500; retail and textile shops | <1% | |
| Brazilians | A suburb of Paramaribo is called “little Belem” | 20,000 – 40,000 | From 1990 “garimpaieros” – gold diggers; live inland | <1% |
| Europeans | 16th – 19th century; various nationalities, ran plantations | > 700 plantations in northern part | Aimed to run Surinam as colony for home country | <1% |
* % of total population [1]
For tuberculosis, the high prevalence among Amerindians may reflect late presentation because of poor access to care; undiagnosed and untreated patients may facilitate spread in the community.
Yet other explanations need to be considered in the obstetric studies, where the difference in caesarean section rate may be explained by local hospital practices, while the high stillbirth rate among Maroons (only Haïti has a higher rate in the region) is still unexplained.
Also in obstetrics, ethnic differences exist that need clarification. For example, Maroons had the highest stillbirth rate and Javanese women the lowest; the caesarean section rate was 24% and highest in Hindustani women (32%) and lowest in Maroons (17%). [7]
The need for ethnic profiling
In daily life, ethnic profiling makes us feel uneasy and often causes feelings of discrimination. However, it is important to understand what ethnic diversity means for health care delivery. Epidemiological research helps to understand where the differences in prevalence are and the underlying risk factors; from there targeted interventions may be initiated. Similarly, there may be a difference in response to treatment between ethnic groups for the same condition, within the region or globally; this may result in variable efficacy and adverse drug reactions. Pharmacogenomics is the study of how genes determine the response to drugs; this applies to individuals in the same population as well as on a global scale. There are many studies that report on these differences, for example between Asian, African or Latin-American populations, including those of mixed background. [8-11] It follows that extrapolation of drug response from one population to another (region, ethnic group, minority) should be done with caution, and introduction of any new treatment should ideally be based on locally performed research.
It is important to note that the study of disease epidemiology among ethnic groups and the principles of pharmacogenomics form the basis of equity in health, and that more research is needed. [12]
| Health topic [ref] | How studied | Main Outcome | Interpretation |
|---|---|---|---|
| Hypertension [13] | 5641 patients from Suriname Health study (SuHS) | Overall 26% Creoles, Hindustani, Javanese: most common Amerindians, Maroons, Mixed: lowest | Demographic, life style and anthropometric factors associated with living under urban conditions may be important (fast food, sedentary work, smoking) |
| Heart failure [14] | Cross-section of 889 admitted patients (Suriname Heart Failure Study – SUHF-I study) | Ischaemic Heart Disease • Asian – 52% • African descent – 12% Hypertensive Heart Disease • Asian – 11% • African descent – 39% | Risk factors are common: • hypertension (63%) • diabetes mellitus (39%) • smoking (17%) |
| Diabetes mellitus [15] | 3393 patients from Suriname Health Study (SuHS) | Prevalence of: • pre-diabetes – 7.4% • diabetes – 13% • Hindustani – 23% • Other ethnic groups – 4.7-14.2% | Association of BMI with pre-diabetes or diabetes, that occurred at lower BMI values in Creole and Hindustani people compared to Javanese and Mixed people. |
| Metabolic Syndrome [16] | 2946 patients from Suriname Health Study (SuHS) | Prevalence • Overall – 39% • Hindustani – 53% • Maroons – 24% | Risk factors Female sex, low income, poor living conditions, marital status |
| Tuberculosis [17] | 662 patients extracted from TB registry | Prevalence • Amerindians – 280/100,000 • Creole – 271/100,000 • Hindustani – 69/100,000 | Risk factors • living in remote, rural areas with poor access to health services, low socio-economic status • living in urban areas, HIV infection (38% HIV+ve) • living in rural areas |
| Caesarean rate [7] | 18290 births analysed from nationwide birth registry study | • Overall 24% • Hindustani – 32% • Maroons – 17% | May partly reflect ethnic distributions between hospitals |
| Stillbirth rate [7] | • Overall 15% • Maroons – 25/1000 births • Javanese – 6/1000 births | Stillbirth rate is second highest of the region, causes unknown |
References
- Algemeen Bureau voor de Statistiek Suriname – Census Statistieken 2012. http://www.statistics-suriname.org/index.php/statistieken/downloads/category/30-censusstatistieken-2012. Accessed May 13.
- Poulter, N.R., D. Prabhakaran, and M. Caulfield, Hypertension. Lancet, 2015. 386(9995): p. 801-12.
- Punwasi, W., Doodsoorzaken in Suriname 2009 – 2011. Paramaribo, Ministerie van Volksgezondheid : Bureau Openbare Gezondheidszorg. 2012.
- Brewster, L.M.B., J., Historical Data on Cardiovascular Health in Surinamese Men BMC Res Notes 2018. 11: p. 919.
- Krishnadath, I.S., et al., Ethnic differences in prevalence and risk factors for hypertension in the Suriname Health Study: a cross sectional population study. Popul Health Metr, 2016. 14: p. 33.
- Diemer, F.S., et al., Health literacy in Suriname. Soc Work Health Care, 2017. 56(4): p. 283-293.
- Verschueren, K.J.C., et al., Childbirth outcomes and ethnic disparities in Suriname: a nationwide registry-based study in a middle-income country. Reprod Health, 2020. 17(1): p. 62.
- Katsukunya, J.N., et al., Pharmacogenomics of Hypertension in Africa: Paving the Way for a Pharmacogenetic-Based Approach for the Treatment of Hypertension in Africans. Int J Hypertens, 2023. 2023: p. 9919677.
- Suarez-Kurtz, G., Pharmacogenomics in admixed populations. Trends Pharmacol Sci, 2005. 26(4): p. 196-201.
- Suarez-Kurtz, G., Pharmacogenomic implications of the differential distribution of CYP2C9 metabolic phenotypes among Latin American populations. Front Pharmacol, 2023. 14: p. 1246765.
- Sosa-Macias, M., et al., Pharmacogenetics: ethnicity, treatment and health in Latin American populations. Pharmacogenomics, 2023. 24(9): p. 489-492.
- Jordan, I.K., S. Sharma, and L. Marino-Ramirez, Population Pharmacogenomics for Health Equity. Genes (Basel), 2023. 14(10).
- Diemer, F.S., et al., Hypertension and Cardiovascular Risk Profile in a Middle-Income Setting: The HELISUR Study. Am J Hypertens, 2017. 30(11): p. 1133-1140.
- Sairras, S., et al., Heart Failure Hospitalizations and Risk Factors among the Multi-Ethnic Population from a Middle Income Country: The Suriname Heart Failure Studies. J Natl Med Assoc, 2021. 113(2): p. 177-186.
- Krishnadath, I.S., et al., Ethnic differences in prediabetes and diabetes in the Suriname Health Study. BMJ Open Diabetes Res Care, 2016. 4(1): p. e000186.
- Krishnadath, I.S., et al., Ethnic disparities in the prevalence of metabolic syndrome and its risk factors in the Suriname Health Study: a cross-sectional population study. BMJ Open, 2016. 6(12): p. e013183.
- Gopie, F.A., et al., Ethnic disparities in tuberculosis incidence and related factors among indigenous and other communities in ethnically diverse Suriname. J Clin Tuberc Other Mycobact Dis, 2021. 23: p. 100227.

